実践的ノウハウ
読了時間
約 20 分
#Kubernetes#Docker#コンテナ
Kubernetes + Docker実践ガイド【2025年コンテナ技術完全理解】
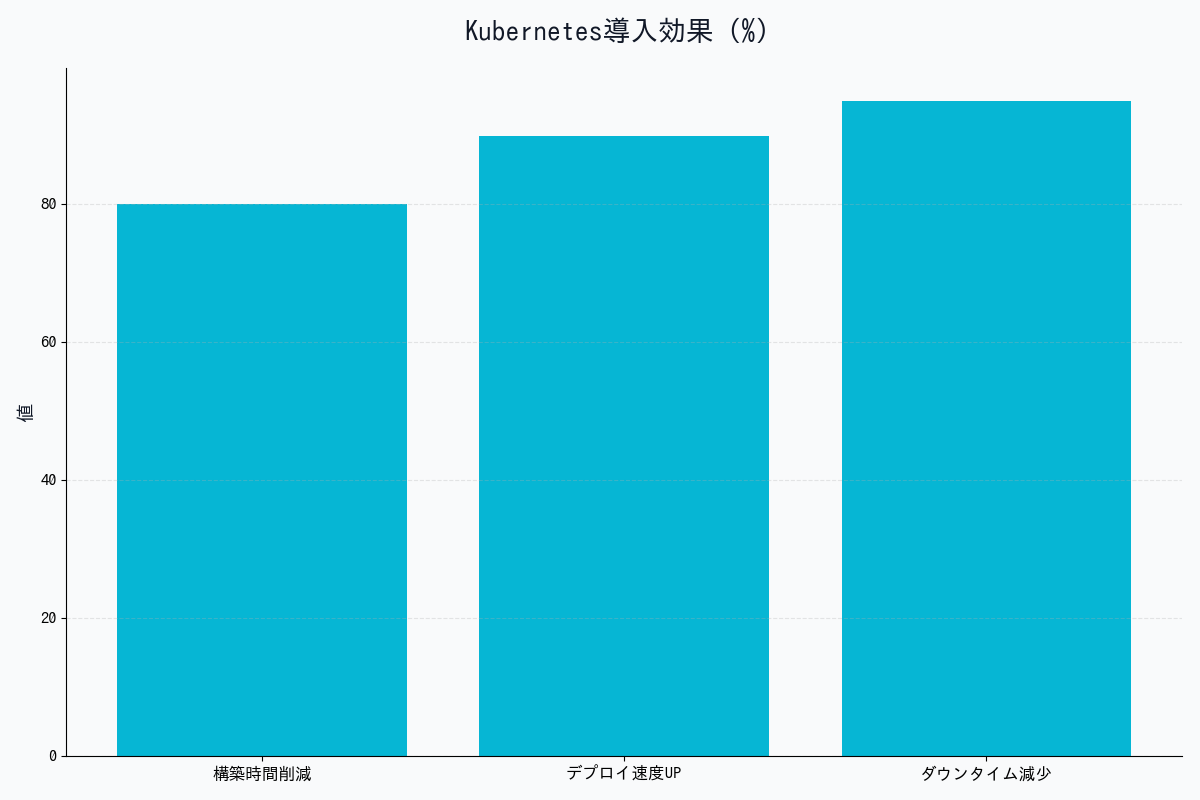
2025年11月現在、コンテナ技術は現代のソフトウェア開発に不可欠なインフラとなっています。本記事では、DockerとKubernetesの基礎から、2025年の最新機能、実践的な運用ノウハウまでを徹底解説します。
Docker基礎:コンテナとは何か
コンテナ vs 仮想マシン
| 項目 | コンテナ(Docker) | 仮想マシン(VM) |
|---|---|---|
| 起動時間 | 数秒 | 数分 |
| メモリ使用量 | MB単位 | GB単位 |
| イメージサイズ | 数十MB〜数百MB | 数GB〜数十GB |
| パフォーマンス | ネイティブに近い | オーバーヘッドあり |
| 隔離レベル | プロセスレベル | OS完全分離 |
| 用途 | マイクロサービス | レガシーアプリ |
Dockerfileのベストプラクティス(2025年版)
# Multi-stage buildで最終イメージを最小化
FROM node:20-alpine AS builder

WORKDIR /app

# 依存関係を先にコピー(レイヤーキャッシュ最適化)
COPY package*.json ./
RUN npm ci --only=production

# アプリケーションコードをコピー
COPY . .
RUN npm run build

# 本番用の軽量イメージ
FROM node:20-alpine

# セキュリティ:非rootユーザーで実行
RUN addgroup -g 1001 -S nodejs && \
    adduser -S nodejs -u 1001

WORKDIR /app

# builderステージから必要なファイルのみコピー
COPY --from=builder --chown=nodejs:nodejs /app/dist ./dist
COPY --from=builder --chown=nodejs:nodejs /app/node_modules ./node_modules
COPY --from=builder --chown=nodejs:nodejs /app/package.json ./

USER nodejs

EXPOSE 3000

# ヘルスチェック
HEALTHCHECK --interval=30s --timeout=3s --start-period=40s \
  CMD node healthcheck.js

CMD ["node", "dist/main.js"]
Docker Composeで複数コンテナ管理
version: '3.9'

services:
  # Webアプリケーション
  web:
    build:
      context: .
      dockerfile: Dockerfile
    ports:
      - "3000:3000"
    environment:
      - DATABASE_URL=postgresql://user:pass@db:5432/myapp
      - REDIS_URL=redis://cache:6379
    depends_on:
      db:
        condition: service_healthy
      cache:
        condition: service_started
    networks:
      - app-network
    volumes:
      - ./logs:/app/logs
    restart: unless-stopped

  # PostgreSQLデータベース
  db:
    image: postgres:16-alpine
    environment:
      POSTGRES_USER: user
      POSTGRES_PASSWORD: pass
      POSTGRES_DB: myapp
    volumes:
      - postgres-data:/var/lib/postgresql/data
    networks:
      - app-network
    healthcheck:
      test: ["CMD-SHELL", "pg_isready -U user"]
      interval: 10s
      timeout: 5s
      retries: 5

  # Redisキャッシュ
  cache:
    image: redis:7-alpine
    command: redis-server --appendonly yes
    volumes:
      - redis-data:/data
    networks:
      - app-network

volumes:
  postgres-data:
  redis-data:

networks:
  app-network:
    driver: bridge
Kubernetes基礎:オーケストレーションの必要性
なぜKubernetesが必要か
Dockerだけの問題点:
├─ 複数サーバーへのデプロイが手動
├─ コンテナ障害時の自動復旧なし
├─ 負荷分散の仕組みなし
├─ ローリングアップデートが困難
└─ スケーリングが手動

Kubernetesの解決策:
├─ 宣言的な設定(YAML)
├─ 自動的なスケジューリング
├─ セルフヒーリング(自動復旧)
├─ サービスディスカバリ
├─ ローリングアップデート
└─ 水平オートスケーリング
Kubernetesの主要コンポーネント
| コンポーネント | 役割 | 配置 |
|---|---|---|
| etcd | 設定情報の保存 | Control Plane |
| API Server | Kubernetesの中心的API | Control Plane |
| Scheduler | Podの配置決定 | Control Plane |
| Controller Manager | 状態管理 | Control Plane |
| kubelet | Podの起動・監視 | Worker Node |
| kube-proxy | ネットワーキング | Worker Node |
基本リソース:Pod
apiVersion: v1
kind: Pod
metadata:
  name: nginx-pod
  labels:
    app: nginx
    env: production
spec:
  containers:
  - name: nginx
    image: nginx:1.25-alpine
    ports:
    - containerPort: 80
    resources:
      requests:
        memory: "128Mi"
        cpu: "100m"
      limits:
        memory: "256Mi"
        cpu: "200m"
    livenessProbe:
      httpGet:
        path: /health
        port: 80
      initialDelaySeconds: 30
      periodSeconds: 10
    readinessProbe:
      httpGet:
        path: /ready
        port: 80
      initialDelaySeconds: 5
      periodSeconds: 5
実践:完全なアプリケーションのデプロイ
1. Deployment(アプリケーション本体)
apiVersion: apps/v1
kind: Deployment
metadata:
  name: api-server
  namespace: production
spec:
  replicas: 3
  selector:
    matchLabels:
      app: api-server
  strategy:
    type: RollingUpdate
    rollingUpdate:
      maxSurge: 1
      maxUnavailable: 0
  template:
    metadata:
      labels:
        app: api-server
        version: v2.1.0
    spec:
      containers:
      - name: api
        image: myregistry.io/api-server:v2.1.0
        ports:
        - containerPort: 8080
        env:
        - name: DATABASE_URL
          valueFrom:
            secretKeyRef:
              name: db-credentials
              key: url
        - name: LOG_LEVEL
          valueFrom:
            configMapKeyRef:
              name: app-config
              key: log_level
        resources:
          requests:
            memory: "512Mi"
            cpu: "500m"
          limits:
            memory: "1Gi"
            cpu: "1000m"
        livenessProbe:
          httpGet:
            path: /healthz
            port: 8080
          initialDelaySeconds: 60
          periodSeconds: 10
          failureThreshold: 3
        readinessProbe:
          httpGet:
            path: /ready
            port: 8080
          initialDelaySeconds: 10
          periodSeconds: 5
2. Service(ロードバランサー)
apiVersion: v1
kind: Service
metadata:
  name: api-server-service
  namespace: production
spec:
  type: LoadBalancer
  selector:
    app: api-server
  ports:
  - name: http
    protocol: TCP
    port: 80
    targetPort: 8080
  sessionAffinity: ClientIP
  sessionAffinityConfig:
    clientIP:
      timeoutSeconds: 10800
3. ConfigMap(設定情報)
apiVersion: v1
kind: ConfigMap
metadata:
  name: app-config
  namespace: production
data:
  log_level: "info"
  max_connections: "100"
  timeout: "30s"
  feature_flags: |
    {
      "new_ui": true,
      "beta_features": false,
      "analytics": true
    }
4. Secret(機密情報)
apiVersion: v1
kind: Secret
metadata:
  name: db-credentials
  namespace: production
type: Opaque
stringData:
  url: "postgresql://user:password@db.example.com:5432/myapp"
  api_key: "sk-1234567890abcdef"
5. Ingress(外部公開)
apiVersion: networking.k8s.io/v1
kind: Ingress
metadata:
  name: api-ingress
  namespace: production
  annotations:
    cert-manager.io/cluster-issuer: "letsencrypt-prod"
    nginx.ingress.kubernetes.io/rate-limit: "100"
    nginx.ingress.kubernetes.io/ssl-redirect: "true"
spec:
  ingressClassName: nginx
  tls:
  - hosts:
    - api.example.com
    secretName: api-tls-cert
  rules:
  - host: api.example.com
    http:
      paths:
      - path: /
        pathType: Prefix
        backend:
          service:
            name: api-server-service
            port:
              number: 80
オートスケーリング
Horizontal Pod Autoscaler(HPA)
apiVersion: autoscaling/v2
kind: HorizontalPodAutoscaler
metadata:
  name: api-server-hpa
  namespace: production
spec:
  scaleTargetRef:
    apiVersion: apps/v1
    kind: Deployment
    name: api-server
  minReplicas: 3
  maxReplicas: 20
  metrics:
  - type: Resource
    resource:
      name: cpu
      target:
        type: Utilization
        averageUtilization: 70
  - type: Resource
    resource:
      name: memory
      target:
        type: Utilization
        averageUtilization: 80
  - type: Pods
    pods:
      metric:
        name: http_requests_per_second
      target:
        type: AverageValue
        averageValue: "1000"
  behavior:
    scaleUp:
      stabilizationWindowSeconds: 60
      policies:
      - type: Percent
        value: 50
        periodSeconds: 60
      - type: Pods
        value: 2
        periodSeconds: 60
      selectPolicy: Max
    scaleDown:
      stabilizationWindowSeconds: 300
      policies:
      - type: Pods
        value: 1
        periodSeconds: 180
Vertical Pod Autoscaler(VPA)
apiVersion: autoscaling.k8s.io/v1
kind: VerticalPodAutoscaler
metadata:
  name: api-server-vpa
  namespace: production
spec:
  targetRef:
    apiVersion: apps/v1
    kind: Deployment
    name: api-server
  updatePolicy:
    updateMode: "Auto"  # 自動でリソース調整
  resourcePolicy:
    containerPolicies:
    - containerName: api
      minAllowed:
        cpu: 100m
        memory: 128Mi
      maxAllowed:
        cpu: 2000m
        memory: 2Gi
CI/CDパイプライン統合
GitHub Actions + Kubernetes
name: Deploy to Kubernetes

on:
  push:
    branches: [main]

env:
  REGISTRY: ghcr.io
  IMAGE_NAME: ${{ github.repository }}

jobs:
  build-and-deploy:
    runs-on: ubuntu-latest
    permissions:
      contents: read
      packages: write

    steps:
    - name: Checkout code
      uses: actions/checkout@v4

    - name: Set up Docker Buildx
      uses: docker/setup-buildx-action@v3

    - name: Log in to Container Registry
      uses: docker/login-action@v3
      with:
        registry: ${{ env.REGISTRY }}
        username: ${{ github.actor }}
        password: ${{ secrets.GITHUB_TOKEN }}

    - name: Extract metadata
      id: meta
      uses: docker/metadata-action@v5
      with:
        images: ${{ env.REGISTRY }}/${{ env.IMAGE_NAME }}
        tags: |
          type=sha,prefix={{branch}}-
          type=ref,event=branch
          type=semver,pattern={{version}}

    - name: Build and push Docker image
      uses: docker/build-push-action@v5
      with:
        context: .
        push: true
        tags: ${{ steps.meta.outputs.tags }}
        labels: ${{ steps.meta.outputs.labels }}
        cache-from: type=gha
        cache-to: type=gha,mode=max

    - name: Set up kubectl
      uses: azure/setup-kubectl@v3
      with:
        version: 'v1.28.0'

    - name: Configure kubectl
      run: |
        echo "${{ secrets.KUBECONFIG }}" | base64 -d > kubeconfig.yaml
        export KUBECONFIG=kubeconfig.yaml

    - name: Deploy to Kubernetes
      run: |
        kubectl set image deployment/api-server \
          api=${{ env.REGISTRY }}/${{ env.IMAGE_NAME }}:${{ github.sha }} \
          -n production

        kubectl rollout status deployment/api-server -n production

    - name: Verify deployment
      run: |
        kubectl get pods -n production -l app=api-server
        kubectl get svc -n production api-server-service
監視とロギング
Prometheus + Grafana
# ServiceMonitor(Prometheus Operatorを使用)
apiVersion: monitoring.coreos.com/v1
kind: ServiceMonitor
metadata:
  name: api-server-metrics
  namespace: production
spec:
  selector:
    matchLabels:
      app: api-server
  endpoints:
  - port: metrics
    interval: 30s
    path: /metrics
Fluentd(ログ収集)
apiVersion: v1
kind: ConfigMap
metadata:
  name: fluentd-config
  namespace: kube-system
data:
  fluent.conf: |
    <source>
      @type tail
      path /var/log/containers/*.log
      pos_file /var/log/fluentd-containers.log.pos
      tag kubernetes.*
      format json
      time_key time
      time_format %Y-%m-%dT%H:%M:%S.%NZ
    </source>

    <filter kubernetes.**>
      @type kubernetes_metadata
    </filter>

    <match kubernetes.**>
      @type elasticsearch
      host elasticsearch.monitoring.svc.cluster.local
      port 9200
      logstash_format true
      logstash_prefix kubernetes
    </match>
セキュリティベストプラクティス
1. Network Policy(ネットワーク分離)
apiVersion: networking.k8s.io/v1
kind: NetworkPolicy
metadata:
  name: api-server-netpol
  namespace: production
spec:
  podSelector:
    matchLabels:
      app: api-server
  policyTypes:
  - Ingress
  - Egress
  ingress:
  # Ingressコントローラーからのみ受信
  - from:
    - namespaceSelector:
        matchLabels:
          name: ingress-nginx
    ports:
    - protocol: TCP
      port: 8080
  egress:
  # データベースへの接続のみ許可
  - to:
    - podSelector:
        matchLabels:
          app: postgres
    ports:
    - protocol: TCP
      port: 5432
  # 外部API呼び出し(HTTPS)
  - to:
    - namespaceSelector: {}
    ports:
    - protocol: TCP
      port: 443
2. Pod Security Standards
apiVersion: v1
kind: Namespace
metadata:
  name: production
  labels:
    pod-security.kubernetes.io/enforce: restricted
    pod-security.kubernetes.io/audit: restricted
    pod-security.kubernetes.io/warn: restricted
3. RBAC(権限管理)
apiVersion: rbac.authorization.k8s.io/v1
kind: Role
metadata:
  name: developer
  namespace: production
rules:
- apiGroups: ["", "apps"]
  resources: ["pods", "deployments", "services"]
  verbs: ["get", "list", "watch"]
- apiGroups: [""]
  resources: ["pods/log"]
  verbs: ["get"]

---
apiVersion: rbac.authorization.k8s.io/v1
kind: RoleBinding
metadata:
  name: developer-binding
  namespace: production
subjects:
- kind: User
  name: alice@example.com
  apiGroup: rbac.authorization.k8s.io
roleRef:
  kind: Role
  name: developer
  apiGroup: rbac.authorization.k8s.io
2025年の最新トレンド
1. WebAssembly(Wasm)サポート
apiVersion: v1
kind: Pod
metadata:
  name: wasm-app
spec:
  runtimeClassName: wasmtime  # Wasm runtime
  containers:
  - name: app
    image: myregistry.io/wasm-app:latest
    resources:
      requests:
        memory: "10Mi"  # Wasmは超軽量
        cpu: "50m"
2. eBPF統合(高速ネットワーキング)
Ciliumを使用したeBPFベースのネットワーキング:
- 従来のiptables比で10倍高速
- L7レベルの可視化
- サービスメッシュ不要
3. GitOps(Argo CD / Flux)
apiVersion: argoproj.io/v1alpha1
kind: Application
metadata:
  name: api-server
  namespace: argocd
spec:
  project: default
  source:
    repoURL: https://github.com/myorg/k8s-manifests
    targetRevision: HEAD
    path: production/api-server
  destination:
    server: https://kubernetes.default.svc
    namespace: production
  syncPolicy:
    automated:
      prune: true
      selfHeal: true
トラブルシューティング
よくある問題と解決方法
| 問題 | 原因 | 解決方法 |
|---|---|---|
| ImagePullBackOff | イメージが見つからない | レジストリ認証、イメージ名確認 |
| CrashLoopBackOff | コンテナが起動直後にクラッシュ | ログ確認、環境変数チェック |
| Pending | リソース不足 | ノード追加、リソース調整 |
| OOMKilled | メモリ不足 | メモリlimit増加 |
デバッグコマンド集
# Pod状態確認
kubectl get pods -n production
kubectl describe pod api-server-xxx -n production

# ログ確認
kubectl logs api-server-xxx -n production
kubectl logs -f api-server-xxx -n production --tail=100

# コンテナ内部に入る
kubectl exec -it api-server-xxx -n production -- /bin/sh

# イベント確認
kubectl get events -n production --sort-by='.lastTimestamp'

# リソース使用状況
kubectl top pods -n production
kubectl top nodes

# ネットワーク疎通確認
kubectl run debug --image=nicolaka/netshoot -it --rm -- /bin/bash
まとめ:実践的な運用チェックリスト
必須項目
- マルチステージビルドでイメージサイズ最小化
- 非rootユーザーでコンテナ実行
- リソースrequests/limits設定
- Liveness/Readiness Probe設定
- HPA設定(最小3レプリカ)
- Ingress + TLS設定
- Network Policy設定
- RBAC設定
- Prometheus監視設定
- ログ集約(Fluentd/Loki)
- CI/CDパイプライン構築
- バックアップ戦略策定
DockerとKubernetesは、現代のクラウドネイティブ開発に不可欠な技術です。本記事で紹介したベストプラクティスを実践することで、スケーラブルで信頼性の高いシステムを構築できます。
画像生成プロンプト集(DALL-E 3 / Midjourney用)
プロンプト1:コンテナ vs 仮想マシンの比較図
Side-by-side comparison diagram showing Docker containers vs virtual machines architecture. Left side shows containers sharing host OS kernel with multiple apps. Right side shows VMs with separate guest OS for each. Technical infrastructure diagram style, blue and orange color scheme, clean layout.
プロンプト2:Kubernetesアーキテクチャ図
Kubernetes cluster architecture diagram showing Control Plane (etcd, API server, scheduler, controller) and Worker Nodes (kubelet, kube-proxy, pods). Hierarchical layout with arrows showing communication flow. Technical system diagram style, blue gradient background, modern tech aesthetic.
プロンプト3:CI/CDパイプライン図
Continuous deployment pipeline flowchart: Git push → GitHub Actions → Docker build → Container Registry → Kubernetes deployment. Each stage with icons and checkmarks. DevOps illustration style, green (success) and blue colors, arrows showing flow, white background.
プロンプト4:オートスケーリングの動作図
Infographic showing Horizontal Pod Autoscaler in action. Graph showing CPU usage spiking, then additional pods being automatically created. Before/after comparison with 3 pods scaling to 10 pods. Technical monitoring aesthetic, real-time dashboard style, colorful metrics.
プロンプト5:マイクロサービスのネットワーク図
Microservices architecture diagram with Kubernetes services, pods, and network policies. Shows ingress → service → pods → database connections with security boundaries. Cloud-native architecture style, purple and blue theme, security shields and locks for isolation.
著者について
DX・AI推進コンサルタント
大手企業グループのDX推進責任者・顧問CTO | 長年のIT・DXキャリア | AWS・GA4・生成AI活用を専門に実践ノウハウを発信中
#Kubernetes #Docker #コンテナ #インフラ #DevOps
最終更新: 2025-11-16
この記事を書いた人
NL
nexion-lab
DX推進責任者・顧問CTO | IT業界15年以上
大手企業グループでDX推進責任者、顧問CTOとして活動。AI・生成AI活用、クラウドインフラ最適化、データドリブン経営の領域で専門性を発揮。 実務で培った知識と経験を、ブログ記事として発信しています。
AI・生成AIDX推進顧問CTOAWS/GCPシステム開発データ分析
詳しいプロフィールを見る